Blog
What about the capabilities in Google Analytics 4 properties?

Millions of companies, small and large, rely on Google Analytics to understand customer likings and generate better experiences for them. With more dealing moving online and businesses under heightened pressure to make each marketing dollar count, insights from digital analytics tools are even more significant.
To help us get better ROI from our marketing for the long term, Google created a new, more intelligent Google Analytics that builds on the base of the App + Web property they introduced in beta last year. It has machine learning at its core to automatically surface valuable insights and gives us a complete understanding of our consumers across devices and platforms.
The new Google Analytics will give us the essential insights we need to be ready for what’s next.
High-level reporting is the key factor of Google Analytics 4 Properties!
Let's get to know reporting in Google Analytics 4 properties.
Summary reports
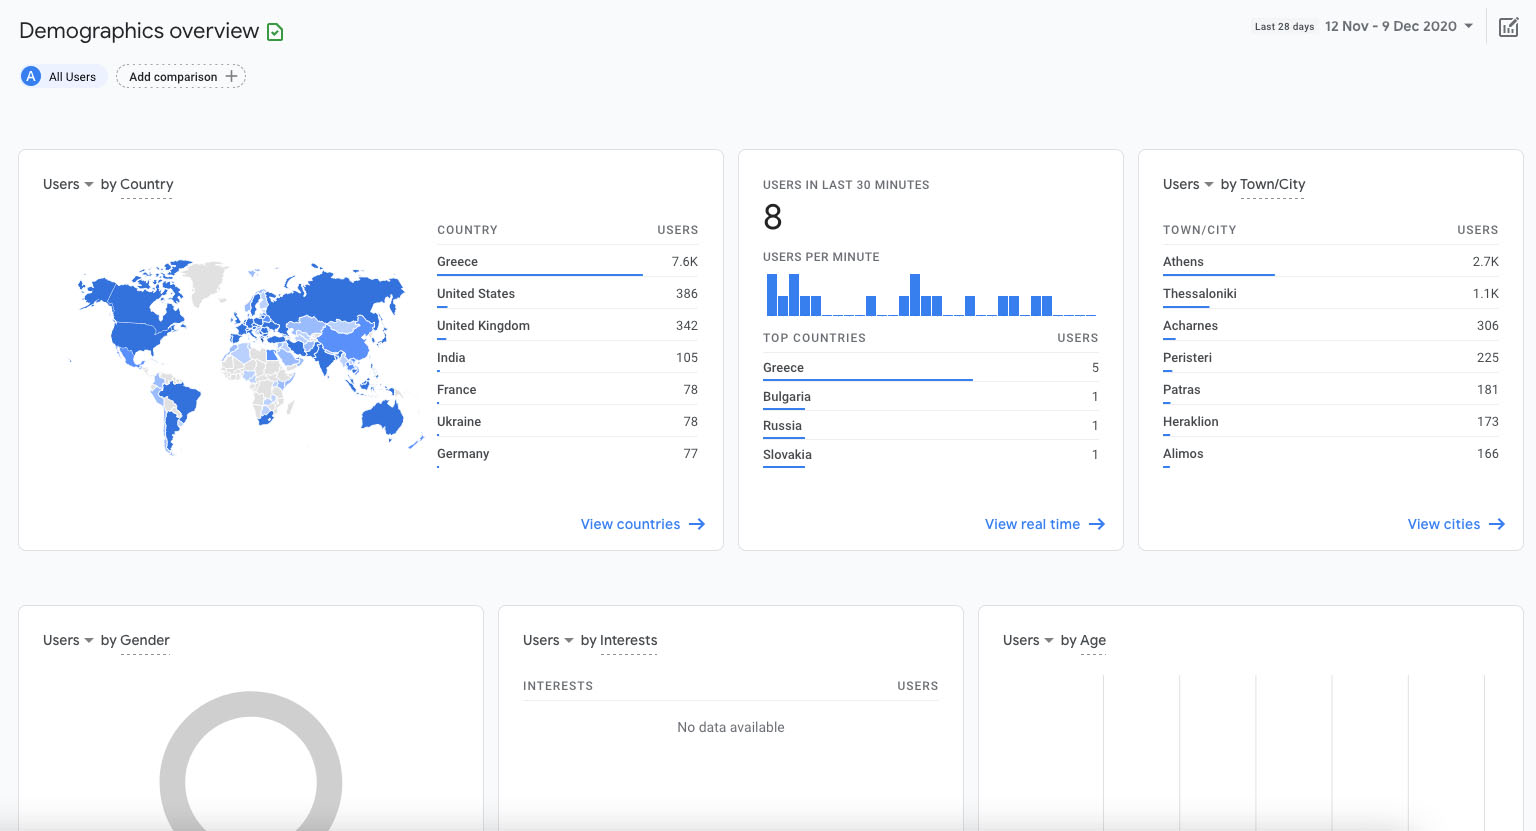
You'll find several different reports listed on the left side of the Analytics interface. Those reports can show you data about your users, like how they found your business and how they're engaging with it. Every report shows a high-level snapshot of these insights using summary cards.
If you want to dig deeper into a particular topic, you can explore a more in-depth, comprehensive report. You can do that by selecting the link at the bottom of each summary card.
The Realtime report

With the Realtime report, you can monitor activity as it happens. This report shows you events that took place between five seconds and 30 minutes ago.
The card-based layout is designed to quickly answer important questions about how your users are currently interacting with your business. Each card represents a stage in the marketing funnel. In this report, you can:
- See different segments of users side by side to compare how they're performing in real-time.
- Easily create a new segment that you can also use in other reports.
Get to know the Analysis techniques
Looking to go deeper? Analysis helps you easily configure and switch between several powerful techniques to better understand your data. These techniques include:
Let's take a closer look.
Exploration

The Exploration technique provides you with a way to visualize your data with flexibility and ease. To conduct an ad hoc analysis, just drag and drop the variables you're interested in onto a canvas to see instant visualizations of your data. Don't see the variable you're looking for? Select the plus icon to view the full list of dimensions and metrics you can use.
This tool presents your data in a cross-tab layout, where you can arrange the rows and columns as you like and add the metrics you're most interested in. You can also apply different visualization styles, including bar charts, pie charts, line charts, scatter plots, and maps.
If you spot a significant data point, right-click on that data point to quickly create an audience or segment from it and use it in other analyses. If you use the line chart visualization, you'll see an automatic feature enabled called anomaly detection. This feature uses machine learning to identify outliers in your data according to your parameters.
Funnel analysis

Funnel analysis lets you visualize the steps your users take toward a key task or conversion. This tool helps you identify sequences of critical events and understand how your users navigate these steps. You'll be able to see where users enter your funnels, as well as where they drop off.
You can gather this information to make improvements on your site or app and reduce inefficient or abandoned customer journeys. You can also easily create audiences of users based on where they enter or exit the funnels you define.
With this tool, you can define up to 10 steps in your funnels, up from five steps in UA properties' Custom Funnels. Plus, you can now analyze both closed funnels (where users must enter at the beginning of the funnel) and open funnels (where users can enter the funnel at any point).
Path analysis

Path analysis lets you understand how people progress from one stage in the customer journey to the next.
Like funnel analysis, path analysis explores the steps users take through your site or app. But while funnels only analyze a single, predefined path, path analysis is free-flowing. It can follow any number of undefined paths, even ones you weren't aware of or didn't intend. For example, it could uncover looping behaviour, which may indicate users becoming stuck.
Plus, you can define paths using either a starting point or an ending point. This technique helps you understand how users got to a specific step on their journey and show you what they did after.
Segment overlap

Segment overlap lets you compare up to three user segments to quickly see how those segments overlap and relate with each other. This method can help you isolate specific audiences based on complex conditions. You can then create new segments based on your findings, which you can apply to other Analysis techniques and Google Analytics reports.
User explorer

User explorer lets you select specific groups of users, like people who both visited your website and downloaded your app, and learn more about each anonymous individual user's activities. Understanding individual behaviour is essential when you want to personalize the user experience or when you need to gain insight into unexpected user behaviours.
Cohort analysis

What if you want to isolate users who share common characteristics? For that use, you can see Cohort Analysis. Cohort is a group of those users identified in this report by a specific event the user has triggered. For example, all users who signed up this week for your newsletter are part of the same cohort. Cohort analysis allows you to explore the behaviour of these groups over time on your app or website.
Get to know the Analysis hub

The Analysis hub is the main landing page for Analysis. It shows previously created analyses and templates for new analyses. It also allows you to create new analyses from scratch. You can start with a blank canvas or use the templates for each of the techniques outlined above. You can also see analyses that other users have shared with you.
Analyses are private by default. If you're the creator, only you can view and edit them unless you choose to share.
Find what you need with the search tool
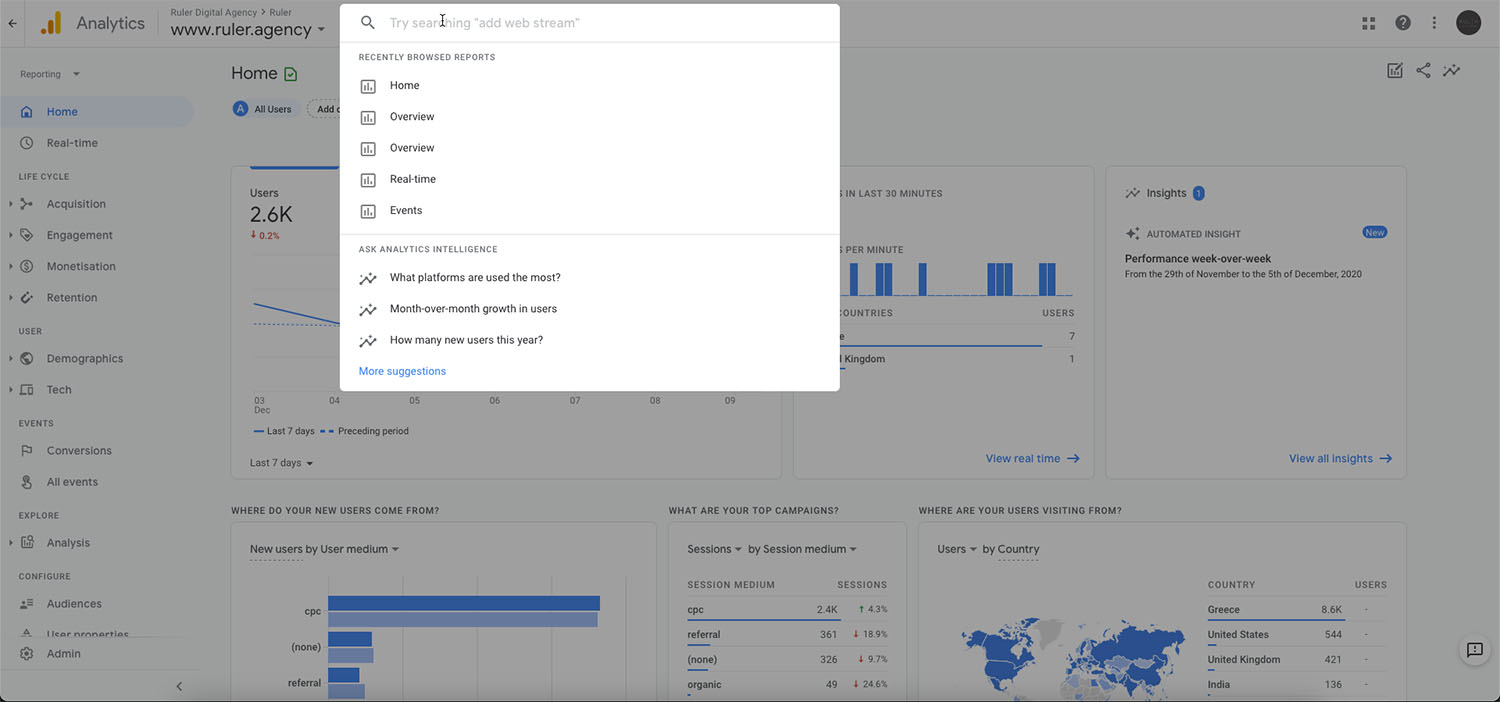
Want to find a specific report or insight? Search what you are looking for using the search box at the top of your Analytics account! When you select the search box, you'll also see recent searches and reports you've opened.
The Search is available in all languages supported by GA4 properties in Google Analytics.
Search for instant answers
You can ask a wide range of questions about your Analytics data, and get quick answers. While searching, be precise about the metric, dimension, and the time frame you are interested in so you get the right result.
For instance, you can search for 'conversions last month from the United Kingdom' and see the answer in the search panel. Select the search result to find more details.
Search for reports, admin pages, or insights
Start typing the name or the keyword related to a report. Type the dimensions or metrics you're interested in to get a list of available reports that include them. For instance, if you start typing "conversions," you'll see reports related to conversions.
You can also search for more specific data, like "mobile users during the last month."
Also, you can search and compare data regarding a specific date range. For example, you can type "new users last week compared to last year" returns reports with the new users metric for the previous week, compared with the same week a year ago.
Search for account or property configuration
To find settings information, enter search terms like property ID or account ID.
Search help content
If you need assistance with Analytics, enter a description of your subject, like "add web stream."
Key Takeaways
- Reporting in GA4 properties is simple: A handful of overview reports each cover a single insight about your business, with the option to learn more by selecting the link at the bottom of each summary card.
- Use the Analysis tool to drill even deeper into your data. The different Analysis techniques allow you to home in on the specific insights you care about and export custom data sets.
- Use the search input at the top of your Analytics account to find what you need.
Source - Info from: https://support.google.com

